Introduction to Reverse Engineering
I made a lot of security workshops for developer students and I particulary like to see them succeed Reverse Engineering challenges. Why ? Because it is so damn hard to start out in this topic ! One need to have a very good understanding of all the binary creation and execution processes before solving a basic exercice !
The purpose of this post is to help people with basic knowledge in C and UNIX systems to start out in Reverse Engineering challenges.
I will only illustrate this post with ELF x86 binaries made from C code. If you don’t know yet what it means, don’t worry we will cover that !
I recommend you take some time to make some small programs to test each step of this post. Reading is great, practicing is better !
Understand the CPU
The processor (or CPU) is the physicial component which is used to execute instructions. For example “call this address” or “add 1 to the variable stored at that address”.
What is an Intel x86 Instruction ?
There are many CPU/processor designs. We call them processor architectures. You may have heard of ARM architecture for smartphones and x86 architecture for Intel processors for example.
These architectures define the way CPU make operations, called instructions. Each processor architecture has its own instruction set.
Registers
Your processor needs some space to store the results of ongoing instructions, and accessing a value in RAM every operation is quite long.
Actually each processor has its own memory spaces, called registers. They are physically in the processor and fasten the access to some instruction data.
To illustrate how the CPU uses registers, let’s say you want to do a += b where a = 1 and b = 2, you will fasten your operation by using the processor this way:
- MOVE the value stored at the address of
ain RAM into a register. - ADD the value of the value of b to the register’s value and store the result in the register.
- MOVE the content of the register at
a’s address (in RAM).
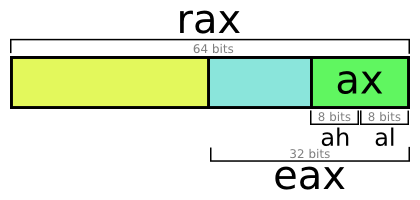
The size of the register is an important information. Old computers had 8 bits registers for example. Today the most common sizes are 32 bits and 64 bits.
There is a naming convention for registers. We will use the register a as an example, it is usually used to store functions’ return value. If you see the prefix r then it is a 64 bits register (rax) and e a 32 bits (eax).
Don’t be surprised if, in a program made for 64 bits architecture, you see the use of 32 bits register names : you can use only half of your 64 bits register !
Understand Intel x86 assembly
First of all, let’s see what a label is. A label is a group of instruction, like a small function. It does not change the execution flow, its only purpose is to have a more readable code.
For example here we have two labels main and end, the instructions are executed in this order : instruction1, instruction2, instruction3.
    main:
        instruction1
        instruction2

    end:
        instruction3
With Intel syntax, instructions are written this way :
instruction destination, source
Let’s see some examples to understand this syntax.
Move the value 1 inside the rax register.
mov rax, 0x1
Substract the value contained in rax by the value contained in rbx. The result is stored inside rax.
sub rax, rbx
Some exceptions to this syntax
Call a global label.
call strlen
Jump to an adress.
jmp 0x12345678
Comparisons in asm are quite different than from higher-levels languages. They start with the instruction cmp which will set a flag in the register FLAGS so we can determine what to do next : jump equal je, jump not equal jne, jump less equal jle etc.
    cmp rax, 0x1
    je error
    jne end
Where error and end are labels.
As a final example, let’s see a basic implementation of the strlen function in 64bits.
    BITS 64                         ; specifies that the targeted architecture is in 64 bits

    section .text                   ; we will see what it means
    global strlen                   ; sets the strlen label to a global label

    strlen:
        xor rcx, rcx                ; set counter 0 (register c is usually used as a counter)
        jmp .LOOP                   ; go to LOOP label

    .INCREMENT:
        inc rcx                     ; increment counter

    .LOOP:
        cmp BYTE [rdi+rcx], 0       ; compare current char to 0 (checks if we are at the end)
        jne .INCREMENT              ; jump to '.INCREMENT' label if not finished
        mov rax, rcx                ; set return value to total length
        ret                         ; end
What is a binary file ?
The binary file is what we study in a Reverse challenge. It is important to have a good understanding of how it is created and what it contains.
A binary is produced by a compiler, gcc for example, from an original source code. The generated file contains data in a non-human readable format (non-printable bytes).
It contains all the information needed to execute your program, like the value of global variables, or the instructions which represent your program logic.
Executable binary format
Binary files are machine-readable files and are executed by your system, or a specific Virtual Machine. They must therefore conform the system/vm Application Binary Interface (A.B.I.).
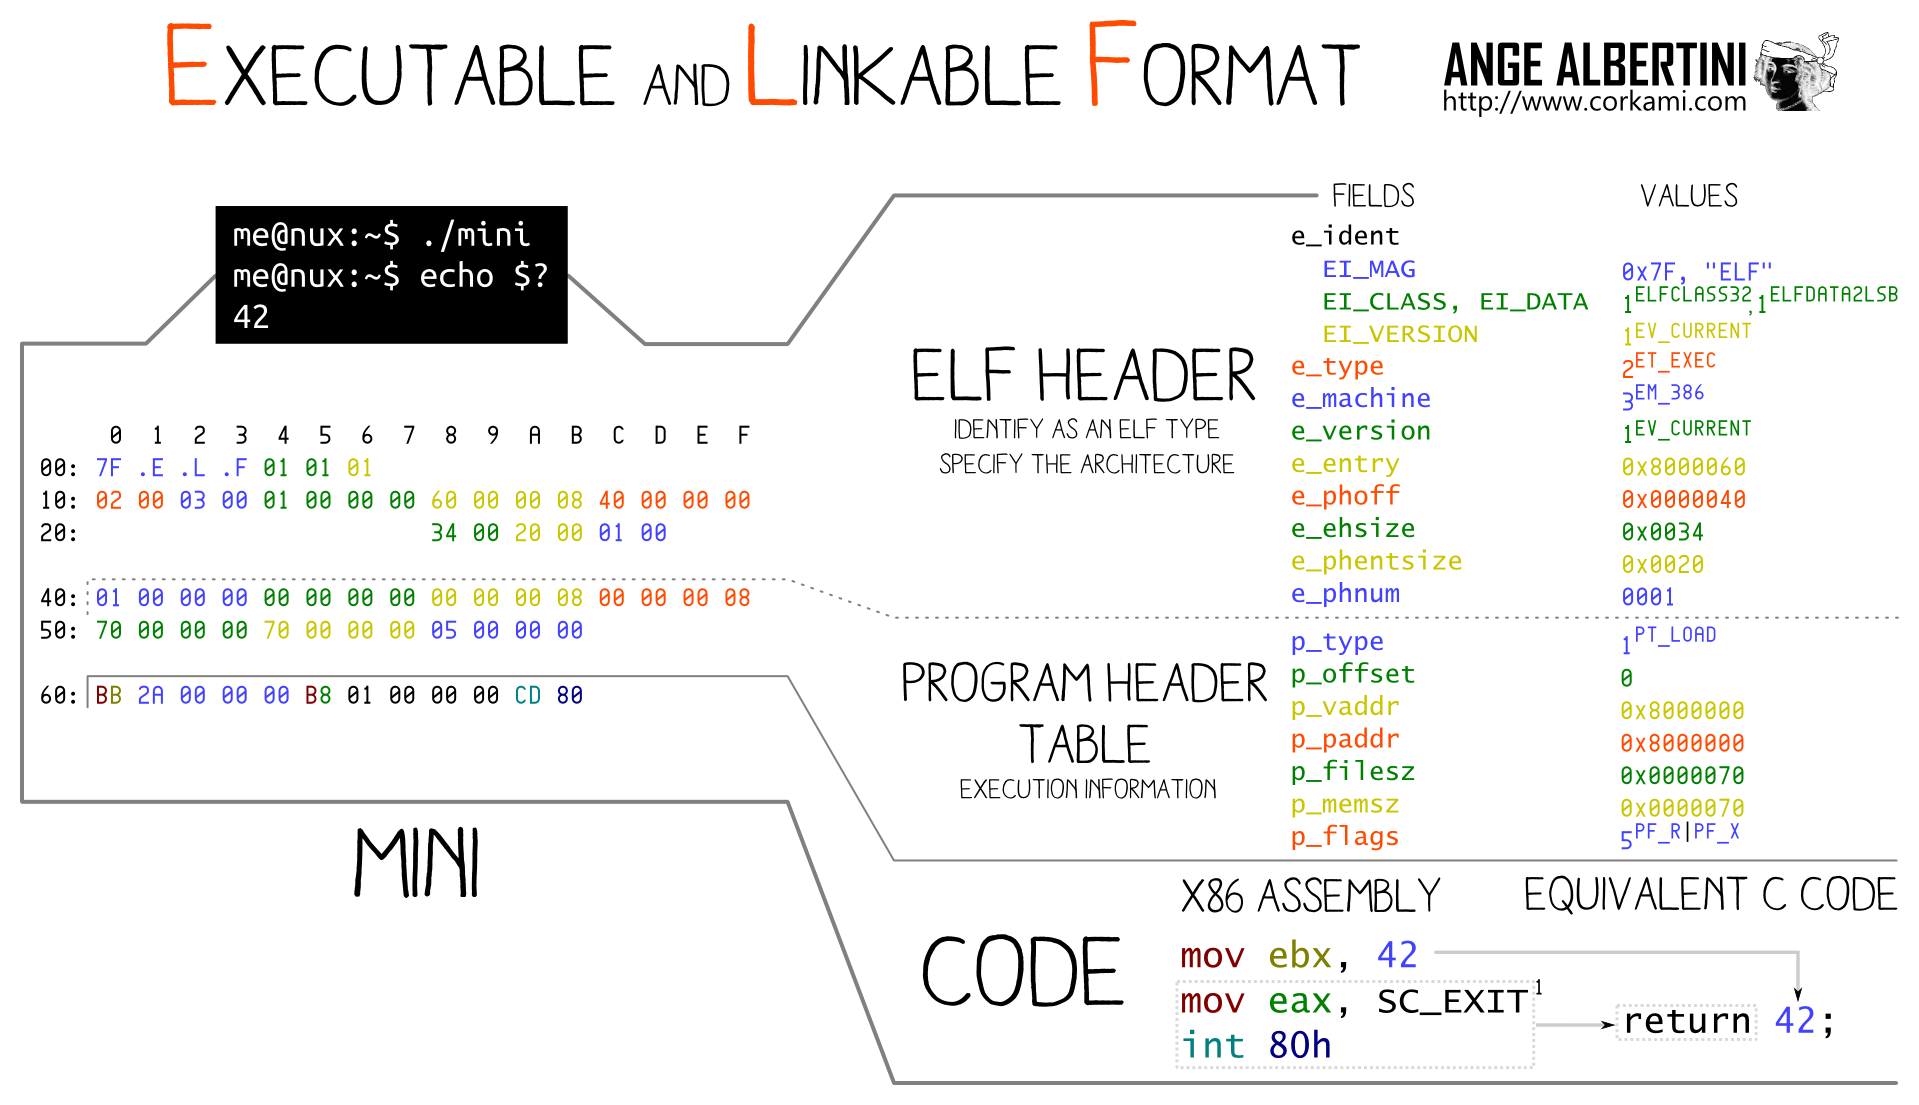
This organisation is called an executable file format. The most famous are MACH-O for MacOS, PE for Windows and ELF for UNIX systems.
We will focus on ELF binaries in this post. Here is a graphical cheatsheet on ELF made by Ange Albertini :
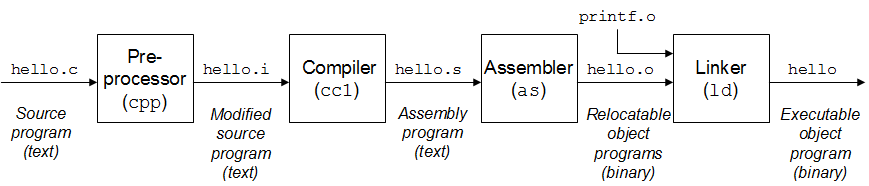
How is a binary file generated with GCC
GCC, which stands for GNU Compiler Collection, is used to compile C code into an executable binary file. This process is composed of 4 main steps.
Let’s say we want to compile this C code :
    #include <stdio.h>

    int main(void) {
        int i = 0;

        i += 1;
        printf("%d\\n", i);
        return 0;
    }
When we compile it by doing gcc main.c, here is what happen :
Pre-Processor
GCC calls a sub-program called the pre-processor which will take care of all the pre-processing directives. For example all includes and defines.
The main job of this program is to replace macros by values (declared with #define for example) or headers (with #include).
We can trigger the pre-processor with the -E flag :
gcc -E main.c
    // lot of stdio.h stuff
    //...
    extern void funlockfile (FILE *__stream) __attribute__ ((__nothrow__ , __leaf__));
    # 858 "/usr/include/stdio.h" 3 4
    extern int __uflow (FILE *);
    extern int __overflow (FILE *, int);
    # 873 "/usr/include/stdio.h" 3 4

    # 2 "main.c" 2

    # 3 "main.c"
    int main() {
     int i = 0;

     i += 1;
     printf("%d\\n", i);
     return 0;
    }
Compiler
This step is called the compilation (yes compilation is a part of the binary compilation…).
It takes the result of the pre-processor and outputs the Assembly code generated from the source.
Assembly is the lowest-level language readable by a human. It can simply be summarized as words replacing binary instructions. Its purpose is to help us read machine language.
gcc -S -masm=intel main.c
    .file   "main.c"
        .intel_syntax noprefix
        .text
        .section    .rodata
    .LC0:
        .string "%d\\n"
        .text
        .globl  main
        .type   main, @function
    main:
    .LFB0:
        .cfi_startproc
        push    rbp
        .cfi_def_cfa_offset 16
        .cfi_offset 6, -16
        mov rbp, rsp
        .cfi_def_cfa_register 6
        sub rsp, 16
        mov DWORD PTR -4[rbp], 0
        add DWORD PTR -4[rbp], 1
        mov eax, DWORD PTR -4[rbp]
        mov esi, eax
        lea rdi, .LC0[rip]
        mov eax, 0
        call    printf@PLT
        mov eax, 0
        leave
        .cfi_def_cfa 7, 8
        ret
        .cfi_endproc
    .LFE0:
        .size   main, .-main
        .ident  "GCC: (GNU) 9.1.0"
        .section    .note.GNU-stack,"",@progbits
Assembler
Converts the Assembly code to binary machine code.
gcc -c main.s && hexdump -C main.o
Allow us to see our generated file content, byte per byte.
    00000000  7f 45 4c 46 02 01 01 00  00 00 00 00 00 00 00 00  |.ELF............|
    00000010  01 00 3e 00 01 00 00 00  00 00 00 00 00 00 00 00  |..>.............|
    00000020  00 00 00 00 00 00 00 00  c0 02 00 00 00 00 00 00  |................|
    00000030  00 00 00 00 40 00 00 00  00 00 40 00 0d 00 0c 00  |....@.....@.....|
    00000040  55 48 89 e5 48 83 ec 10  c7 45 fc 00 00 00 00 83  |UH..H....E......|
    00000050  45 fc 01 8b 45 fc 89 c6  48 8d 3d 00 00 00 00 b8  |E...E...H.=.....|
    ...
Linker
It merges all the .o generated files of your project. This program is for example made to replace the function calls by their respective address.
gcc main.o
$ ./a.out
1
How is a binary file executed ?
Now that we know what a binary file is and how it is generated, we are going to see how it is executed by your system.
Memory Segmentation
When your program is executed, your system assignes to it a certain amount of RAM memory. This memory is segmented in different parts :
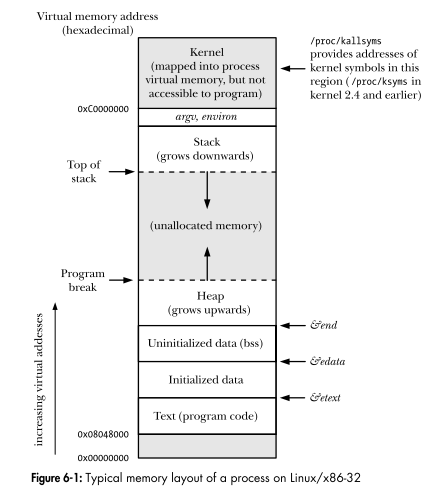
Let’s focus on the interesting parts for this post.
Text
This section contains the content of the executed binary file. It is used to read all the instructions that have to be executed during the execution of your program.
Data & BSS
They both contain global and static variables. If they are initialized, they are stored in DATA, else in the BSS segment.
The Heap
This part is used to store dynamically allocated data. The developer interacts with it by using malloc realloc or free for example.
The Stack
The understanding of this section is really important to fully perceive how binary execution works.
The Stack is a LIFO (Last In First Out) data structure. Which basically means that you push and pop element from the same side of the stack.
tips: Think about it like a plate stack !
The tricky thing here is that the Stack is actually reversed. You push and pop elements on the lowest address of the stack.
Let’s see what happen when we execute a simple binary in 32 bits.
static int increment(int number)
{
return number + 1;
}
int main(void)
{
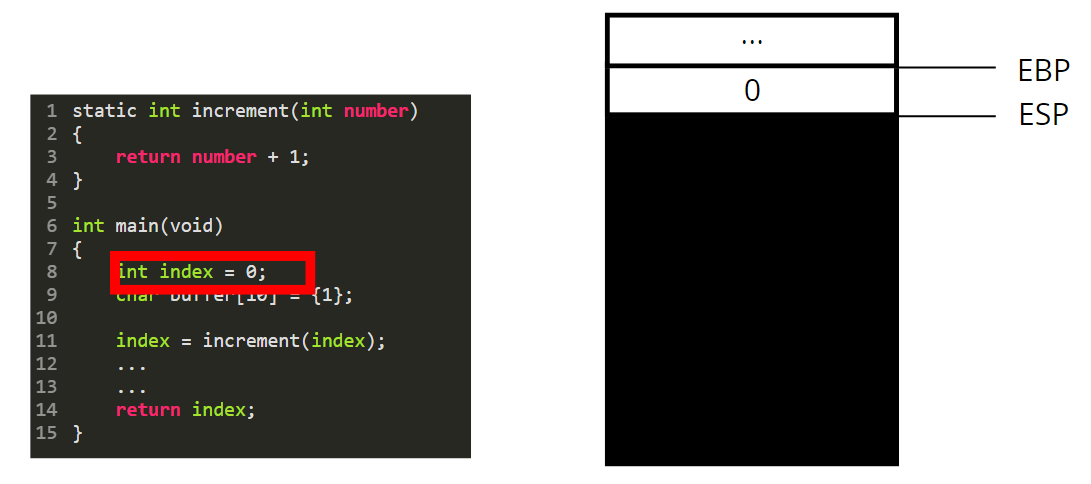
int index = 0;
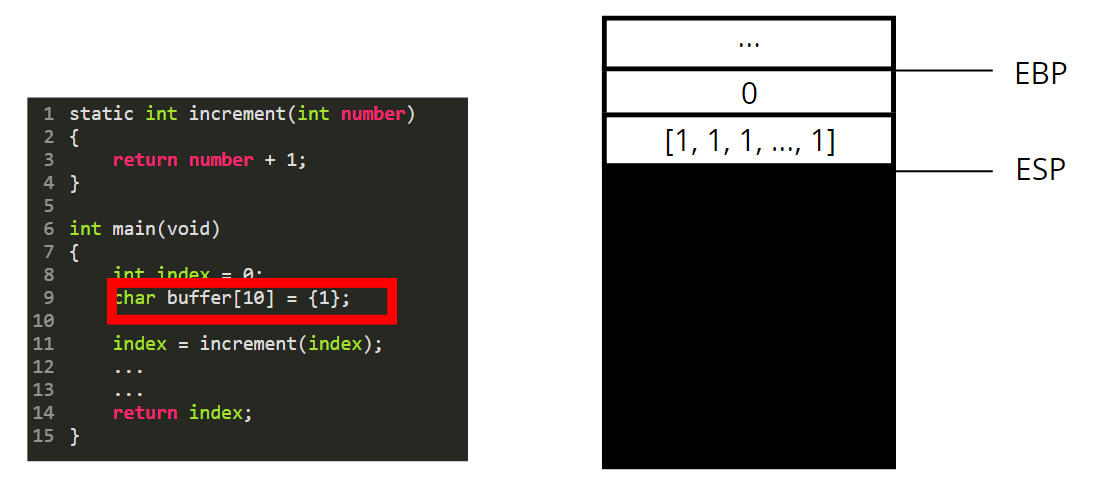
char buffer[10] = {1};
index = increment(index);
... // other stuff to execute in main
...
return index;
}
Before we start the execution, we should know a few registers:
* ebp (base pointer) always contains the address value of the current stack beginning
* esp (stack pointer) contains the address of the stack end
* eip (instruction pointer) holds the address of the next instruction to execute (in the text section)
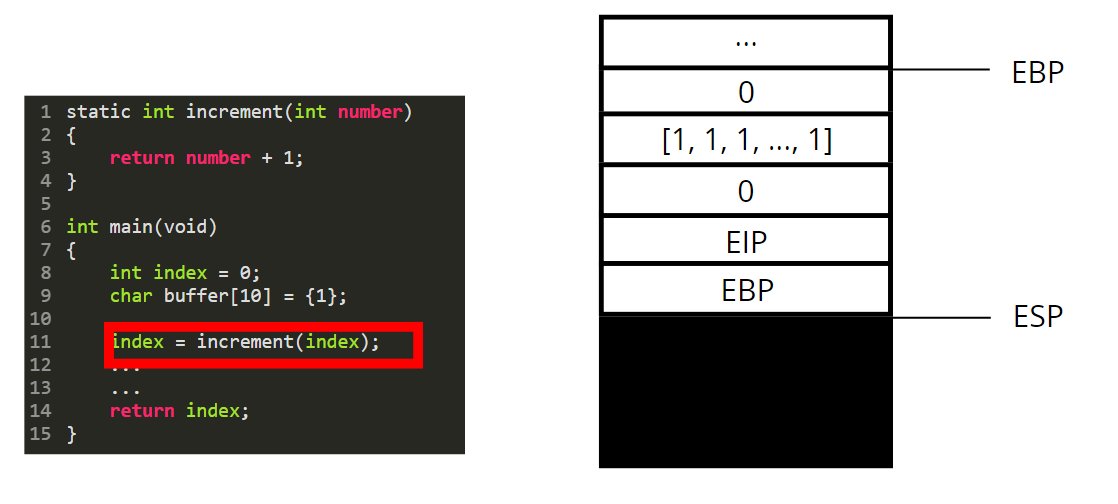
We declare an integer index and initialize it to 0. The value 0 is thus pushed on the stack.
Same thing happens for the buffer: 10 bytes set to 1 are pushed on the stack.
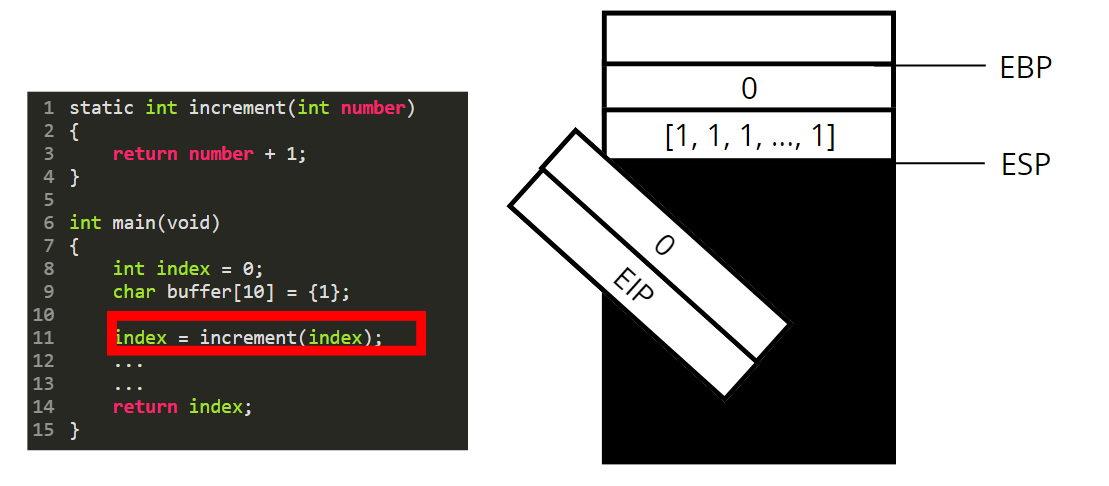
Then we are going to call the function increment. For that we need to perform a few steps.
* As we are in 32 bits mode, the function parameters are pushed on the stack (in 64 bits they are passed through registers and not pushed on the stack).
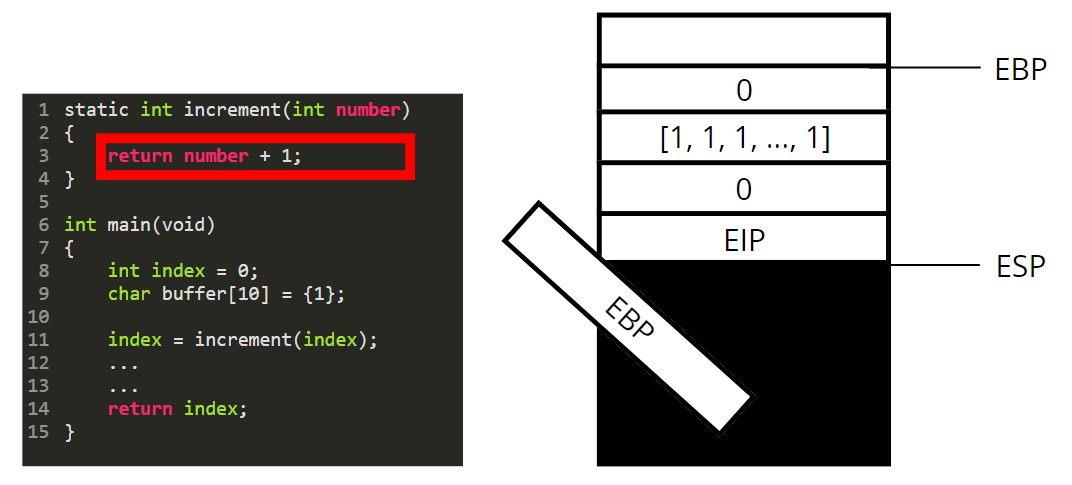
* We then push the content of EIP, to save the next instruction we should execute in the main function
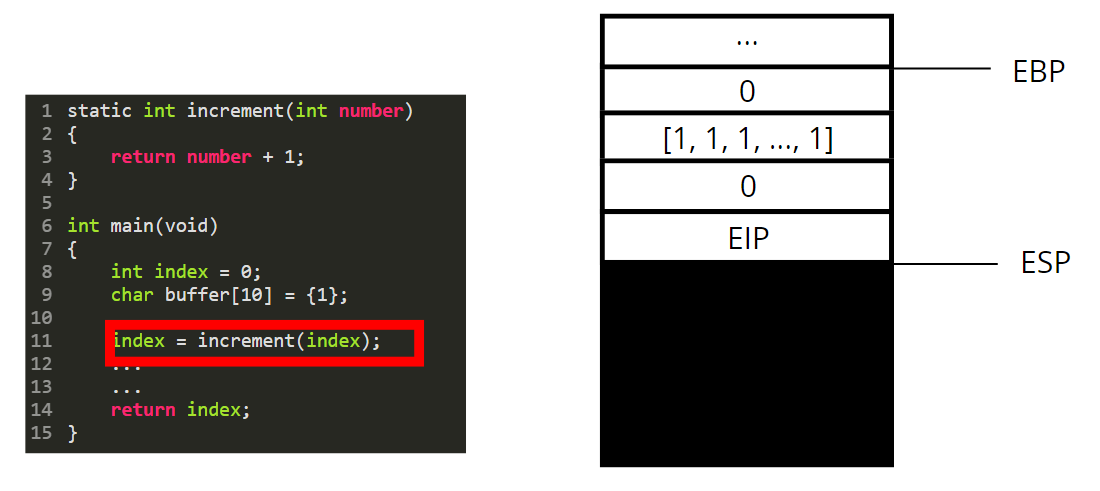
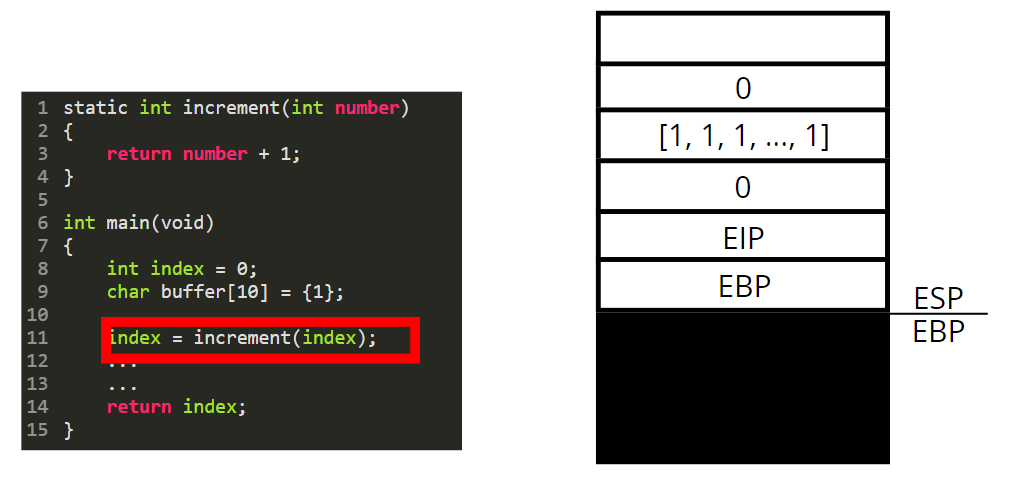
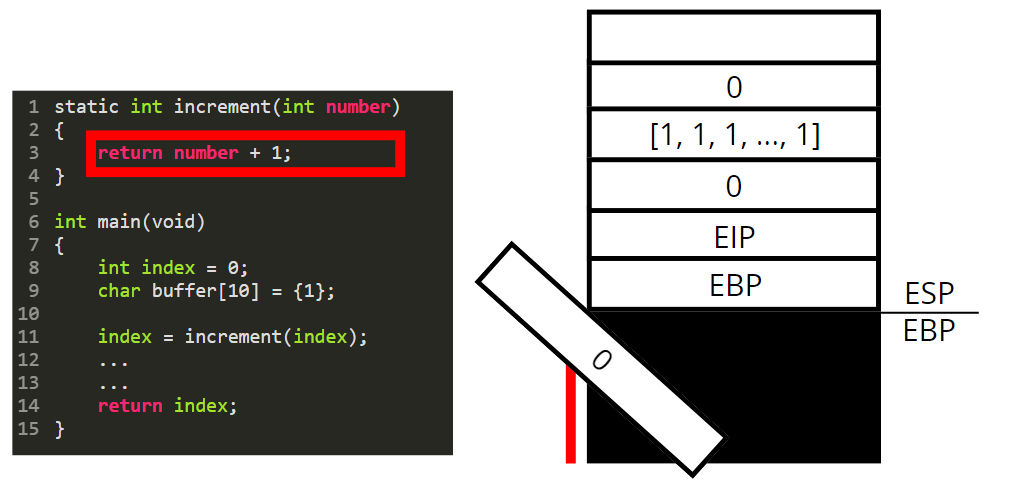
We then push the content of the EBP register.
We set the base pointer (EBP) to the value of the stack pointer (ESP).
Now we are in “the context / stack of the increment function”. This “function stack” is called a stackframe.
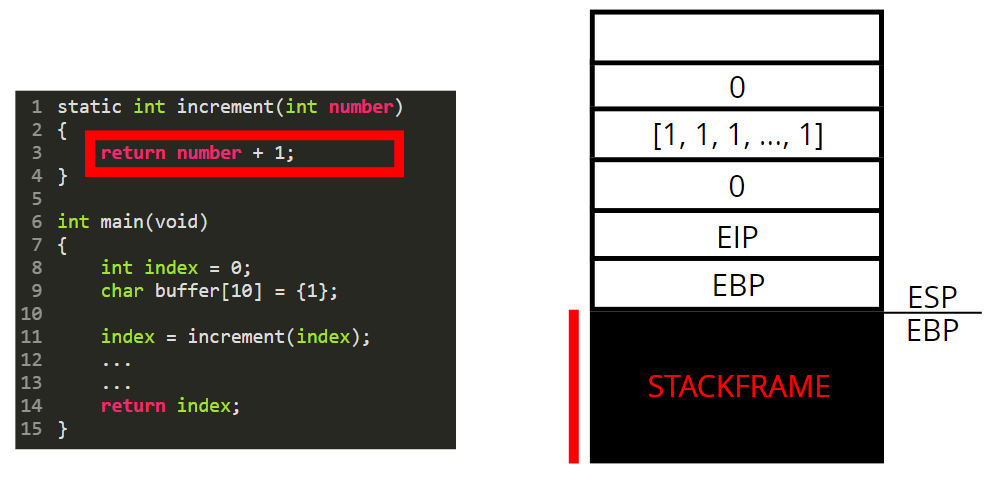
The paramater is used as a variable and is therefore pushed on the stack.
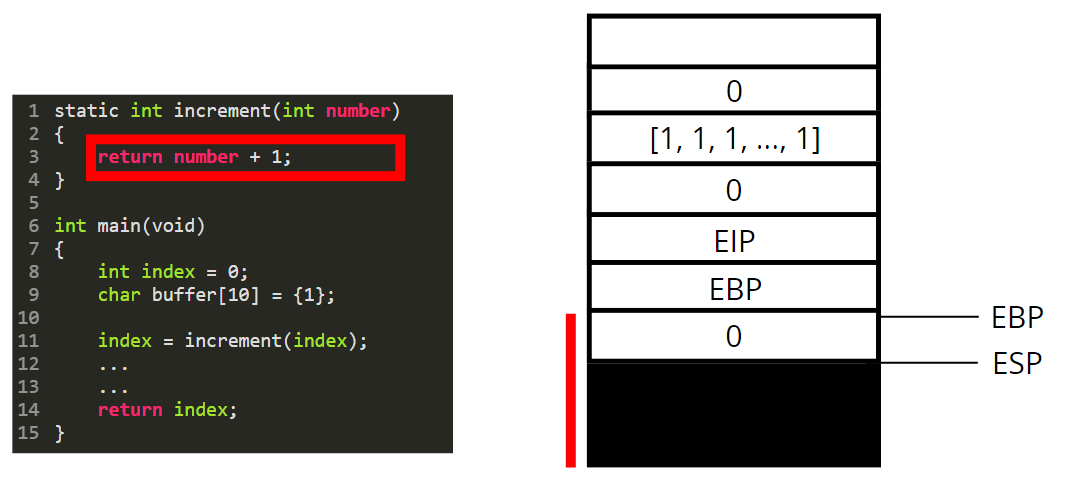
The return value is always stored in the eax register. What is happening here is that we take the value contained in ebp-4, add 1 to it and store the result in eax.
We are now leaving the increment function. To do so we destroy its stackframe by poping every local variables out of the stack.
We reset the value of ebp to go back to the beginning of the main function stackframe.
Finally we reset EIP and pop all parameters passed to the function.
We can know set the value of our local index variable to eax and resume the execution of the main function.
What is a Stack Overflow ?
As we have seen, when we call a function, the current stackframe is saved by pushing some values (ebp, eip…) on the stack. If a code is infinitely recursive, we will push more elements on the stack that it can hold. This error is called a stack overflow.
Endianness - the tricky thing
Endianness represents the organisation of the bytes in memory. You have two main disposition : Little and Big Endian.
Let’s take the example of the 0x12345678 integer (4 bytes).
- Big Endian : 0x12345678 is written 0x12345678 in memory.
- Little Endian : 0x12345678 is written 0x78563412 in memory.
Little endian actually reverse bytes order : ABCD becomes DCBA.
Historically, x86 architecture uses Little Endian. So be careful when you read or write data in memory (RAM or registers) : you’ll have to invert what you got before manipulating it !

N.B: this choice of reversing the byte orders was made to facilitate computations ! Nowadays this advantage does no longer exist as we have powerful CPUs but this convention remained.
Study a binary
In this part we are going to see two ways of studying binaries:
- Static analysis : no execution, only asm reading
- Dynamic analaysis : execution step by step of the program
We are also going to discover some tools to perform those studies.
Basic tools
To start our analysis, we need to know some general information about our binary: what format is it, what architecture does it target ?
file and rabin2
file and rabin2 -I (this one must be installed with radare2) are basic commands which will allow you to have a nice overview of the executable binary file you are dealing with.
    $ file a.out
    a.out: ELF 64-bit LSB executable, x86-64, version 1 (SYSV), dynamically linked, interpreter /lib64/ld-linux-x86-64.so.2, BuildID[sha1]=e22b00cc4aedcc661b07834944ddf9160c1ff5ba, for GNU/Linux 3.2.0, not stripped

    $ rabin2 -I a.out
    arch     x86
    baddr    0x400000
    binsz    19941
    bintype  elf
    bits     64
    canary   false
    class    ELF64
    compiler GCC: (GNU) 9.2.1 20190827 (Red Hat 9.2.1-1)
    crypto   false
    endian   little
    havecode true
    intrp    /lib64/ld-linux-x86-64.so.2
    laddr    0x0
    lang     c
    linenum  true
    lsyms    true
    machine  AMD x86-64 architecture
    maxopsz  16
    minopsz  1
    nx       true
    os       linux
    pcalign  0
    pic      false
    relocs   true
    relro    partial
    rpath    NONE
    sanitiz  false
    static   false
    stripped false
    subsys   linux
    va       true
strace
strace executes your binary and shows you all the system function calls, their parameters and return value.
It’s a really helpful tool to have a nice overview of what is happening in the studied program.
GDB and PEDA
The GNU Debugger (GDB) is a really helpful tool when you need to debug your C / C++ program. With the PEDA plugin, it can be used as a really powerful tool for binary analysis.
So first of all make sure you have gdb installed, and then install PEDA with these commands:
git clone <https://github.com/longld/peda.git> ~/peda
echo "source ~/peda/peda.py" >> ~/.gdbinit
You can now launch gdb (gdb ./a.out) on your binary and see a nice red prompt !
Static analysis
You can use the info functions command to display all the symbols contained in your binary.
Then use the pdisas functionName or pd functionName command to see the instructions contained inside a specific function. You will see that PEDA colors the instructions representing the logic of your program:
- comparisons
- function calls
Try it ! Do a pdisas main on your binary to see its content.
Finally, when you want to see the content stored at a certain address, you can do x/x 0x12345678, where 0x12345678 is the address, to see it represented as hexadecimal data.
Do x/s to see its ASCII representation.
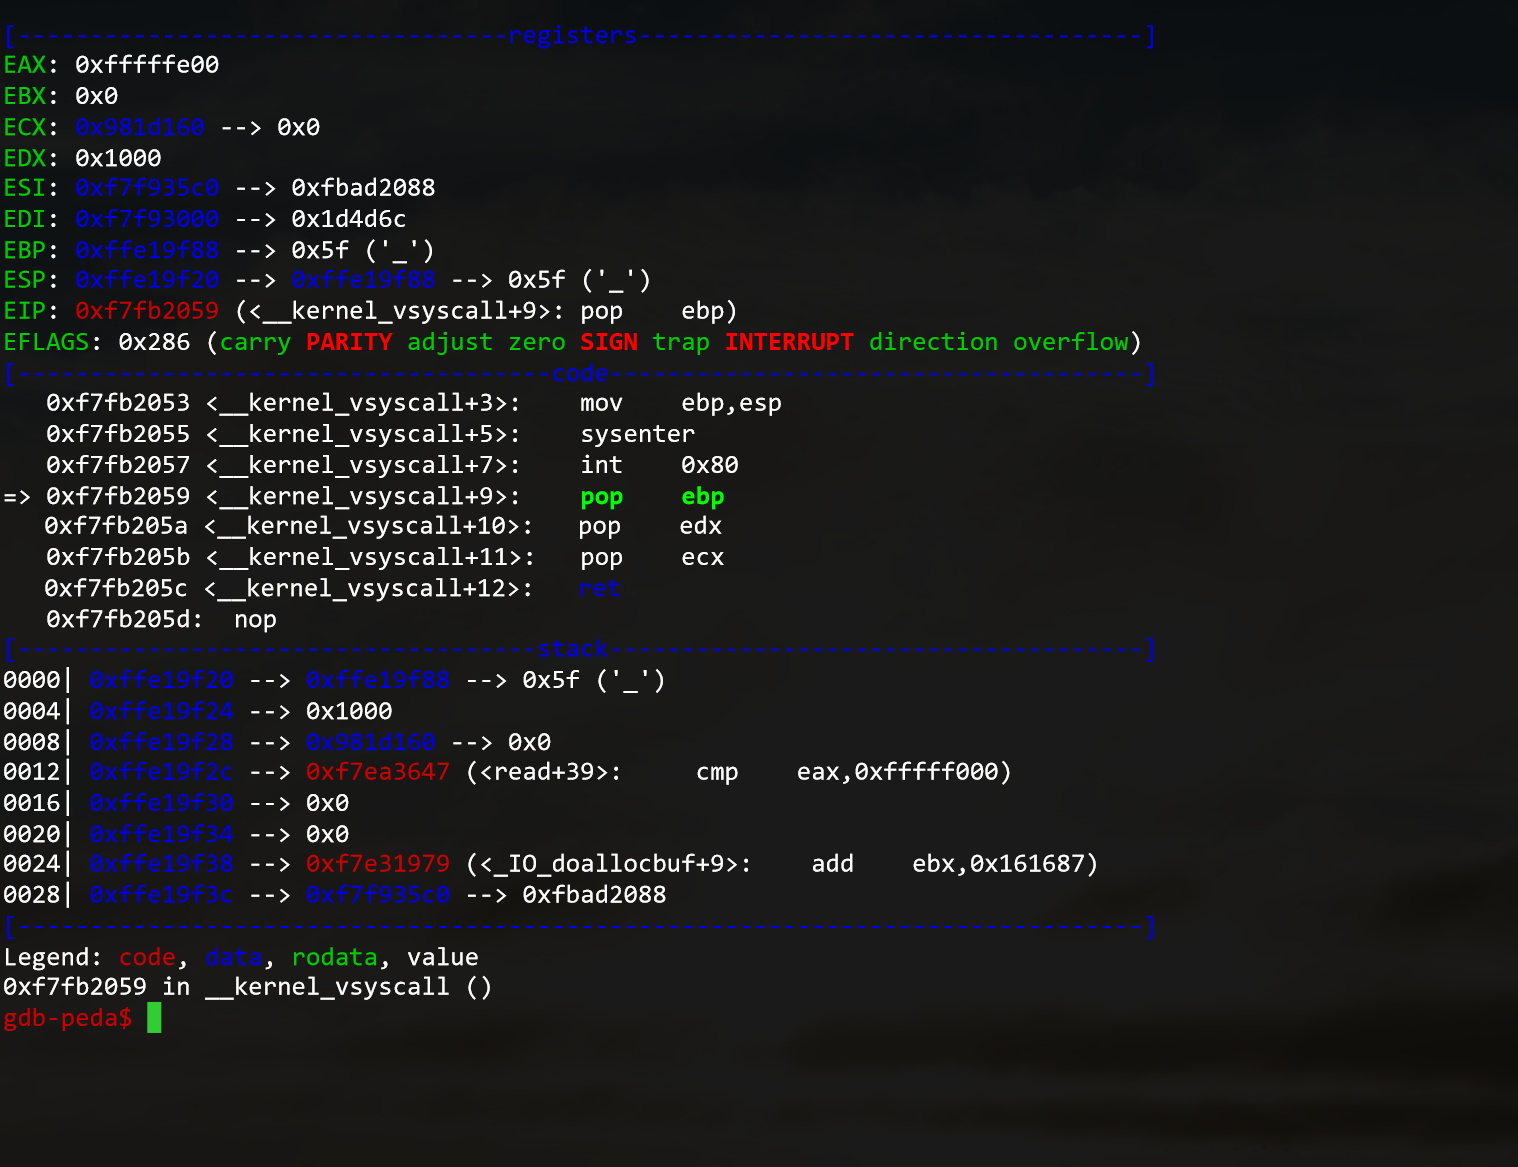
Dynamic analysis
Use the start command to begin the program execution.
Here you can see multiple things :
- The values stored in the registers
- The current and next instructions
- The current state of the Stack
You can do multiple things from here :
sto go to the next instruction- set a breakpoint:
b *0x12345678with 0x1234578 being the targeted instruction address. Note that you can also use gdb notation :b *main+77to set the breakpoint to the instruction referenced as main+77. - go to the breakpoint:
run - get out of a function:
finish - change the value of a register, for example rax:
set $rax=1
Time to practice
Now, you know how a binary is created, executed and what tools we can use to perform a Reverse Engineering analysis. You can train yourself on this workshop.
If you want some help, you can contact me via Twitter DMs !